Intense liquidation of gold mining shares during the week of August 13, 2018 could, in our opinion, mark a trading bottom, if not the terminal point in the lengthy consolidation of the sector since the bottom of December 2015. To support our view, we note:
-Extreme bearish positioning of COMEX gold speculators;
-Extreme bullish positioning of US dollar long speculative positions
-Extreme bearishness in gold sentiment indicators;
-Extreme washout volume on downward spikes of GDX, the Van Eck gold mining share ETF; and
-Extreme improvement in broad macroeconomic and gold-specific microeconomic fundamentals.
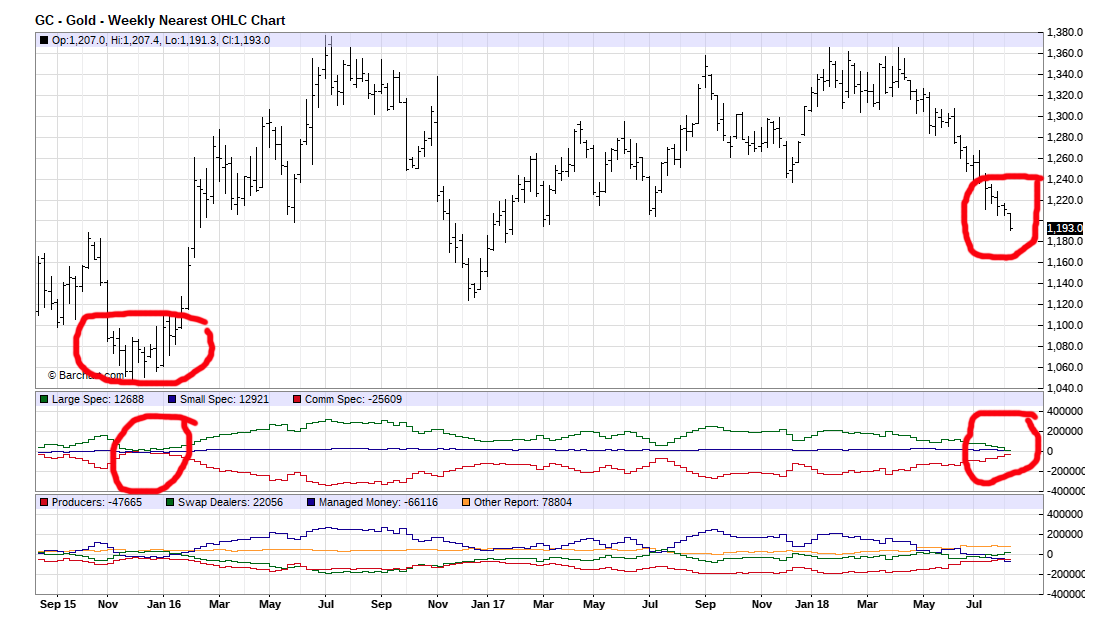
Extreme positioning of COMEX speculators (see chart below):
Gold net speculative positions on COMEX are the lowest since December 2015, which marked a low in the gold price that has held for 2 years and nine months:
The chart below (from Peter Boockvar, CIO of Bleakley Advisory Group) shows that speculators went net short as of 8/14/18 for the first time since 2001 when gold was priced at $275/oz.:
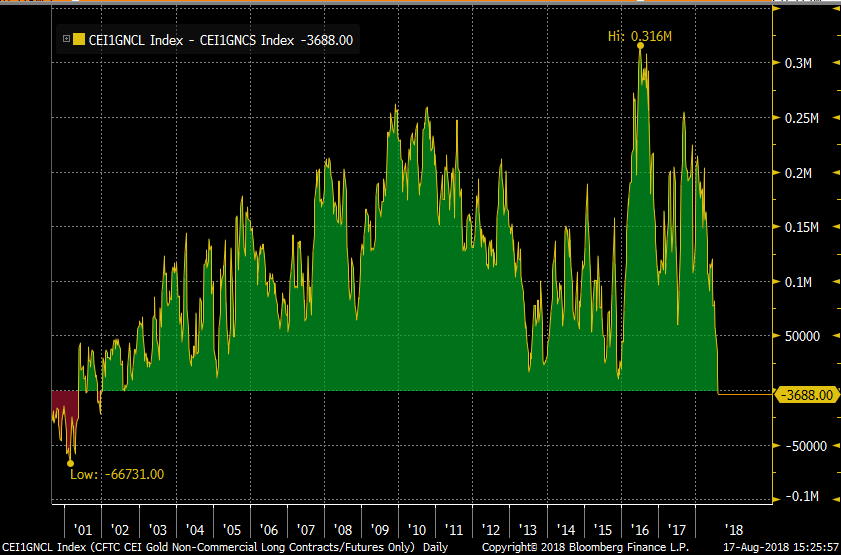
According to Ted Butler (Butler Research, 8/18/18), a keen observer of commodity markets, an increase in the price of gold of only $45/oz., or 3.8%, from the current level of $1185, would wipe out the unrealized aggregate profit of the massive COMEX short position. The current futures market structure appears to be a set up for a dramatic short covering rally that will end up in losses for speculative shorts.
Extreme Bullish Positioning of currency speculators (long dollar/short euro):
Net speculative positions are the highest since January 2017 (see chart below from Meridian Macro Research):
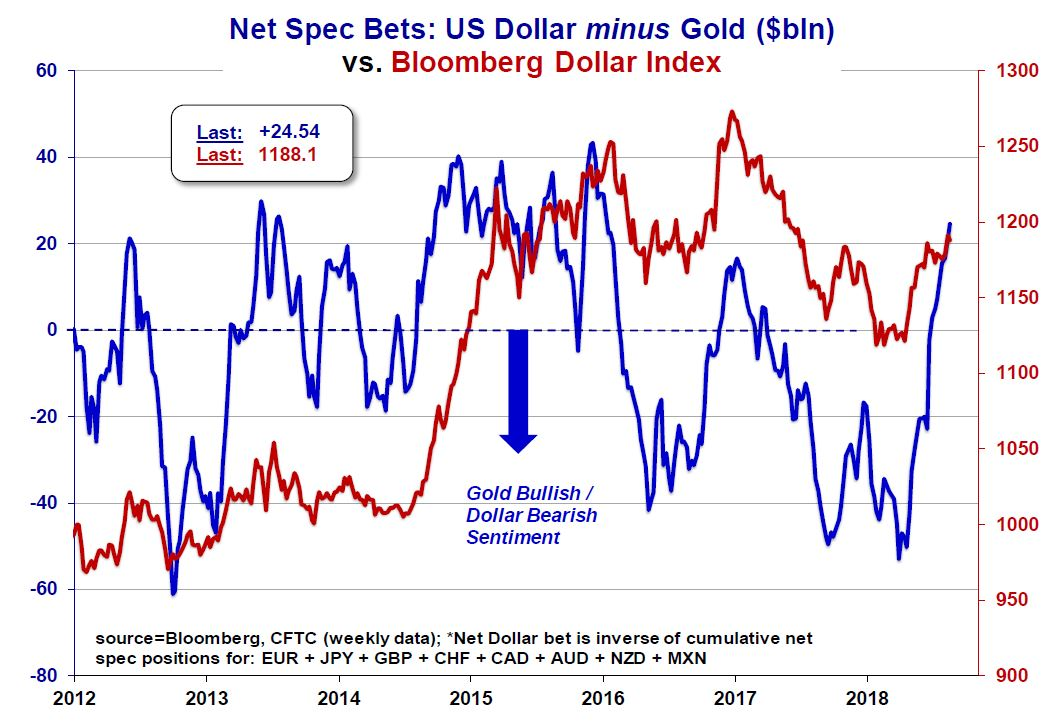
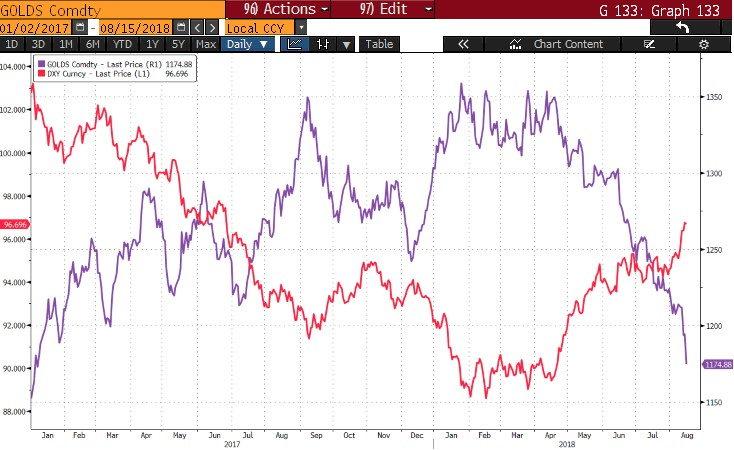
Gold prices over the past year have tended to move inversely with the DXY index (dollar versus major currencies – see chart below). The recent strength of the dollar has been punishing for the gold price, as algorithmic traders seem stuck on the notion that the inverse relationship is inexorable, implementing inverse trade pairs as if it were a sure thing. We hasten to add that if the relative strength of the dollar were the dominant long-term factor in setting the gold price, how does one explain the fact that metal has risen nearly four-fold since 2000 in dollar terms? The financial consensus seems to view the “strong dollar/weak euro & yen” as a positive for the US stock market because it reflects the strong US economic growth vs. a weaker Eurozone. The Bernstein Daily Sentiment Index recorded a reading of 96% bullish as of 8/14/18. According to Trey Reik of Sprott Asset Management USA in his August Strategy Letter, this extreme reading has been exceeded on only five days, or .0006 of the time, during the 7966 trading-day history of the DXY index.
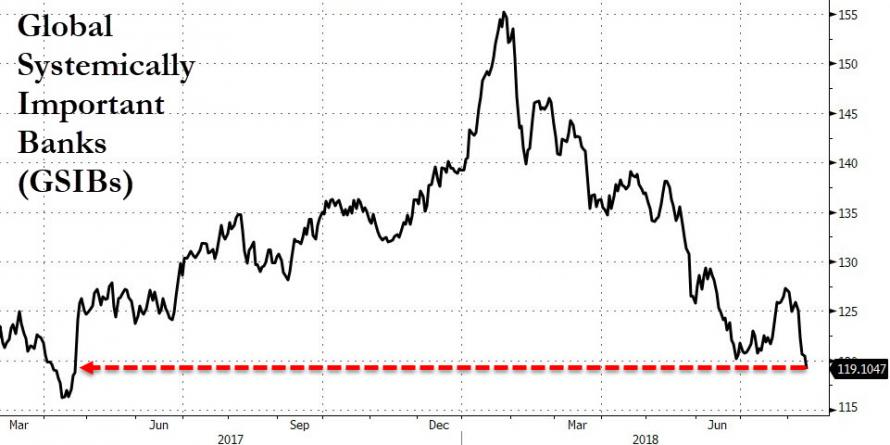
Second, the strong dollar is destabilizing for emerging-market economies, which have borrowed heavily in US dollars to invest in production capacity. This may prove to be uneconomic based upon currency swings and may lead to credit problems for the banking system well beyond the borders of those economies. (See chart below of an index of systemically important banks):
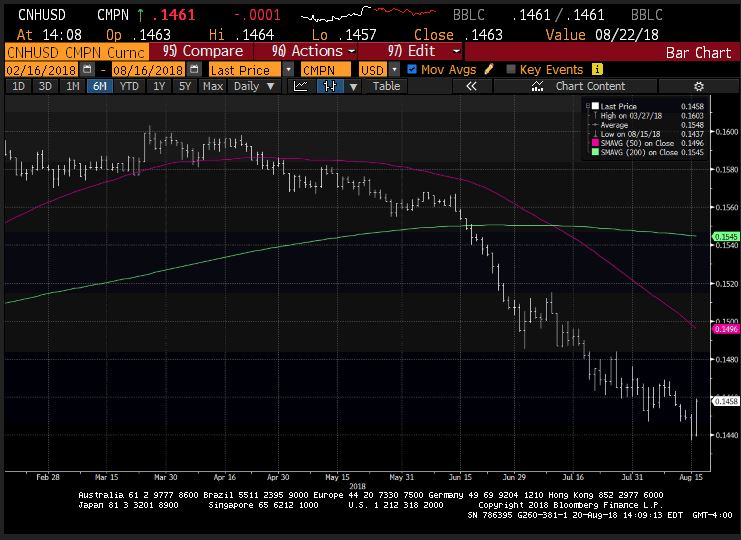
We believe the elephant in the currency room is China, the world’s second largest economy. The significant decline in the renminbi over the past six months, driven by capital outflows, has in our opinion the potential to be more disruptive to global economic stability than the brewing tariff war.
Weakness in the Chinese stock market (the China CSI 300 is down 19.88% year to date 8/17/18, the worst of any major market) reflects slowing growth and widening credit problems. The bullish view that growth in China (along with other emerging markets) will power world growth seems to hold little water.
“Bloomberg reports that July Chinese auto sales were down 4% from a year ago. Does that sound like ‘growth?’ As discussed in recent reports, Chinese P2P online lenders are going poof and disappearing with investor’s money. Those same P2P lenders kept the Chinese real estate and other Ponzi schemes going and the P2P lending demise is going to hurt marginal economic activity.” (Belkin report, Aug. 13, 2018)
According to presidential economic advisor Larry Kudlow (8/15/18), “the Chinese economy looks terrible” and “capital is fleeing the country because of an economic slowdown.” It seems inconceivable to us that the weakness in the Chinese and other emerging-market economies will not have an adverse impact on future economic growth for the US, corporate earnings, and stock market fundamentals:
We believe that Kudlow is undoubtedly correct that the US economy is currently “crushing it,” but it seems to us that it is unlikely that it can do so sustainably if the rest of the world, including emerging market economies and the Eurozone, drifts into recession because of the pronounced weakness of those currencies against the US dollar. The global economy and financial markets are interconnected. The idea that the US is an island of strength that can withstand recession in the rest of the world sounds to us like a battle cry from the 1930s.
Extreme Negative Gold Sentiment:
There are many signs, including the Bernstein DSI, which read only 11% bulls (21 day moving average) as of August 17. This nadir of bearishness has been reached on only five occasions or .00065 of the trading days since 1987 (now, December 2016, October 2014, July 2013 and May 2004). Every prior instance was followed by a significant and (in 4 out of 5 cases) rally lasting several years.
A more anecdotal bell rang loudly, in our opinion, when Vanguard renamed its “Precious Metals and Mining Fund” to “Global Capital Cycles.” It is worth noting that Vanguard launched their precious metals fund in 1984, near the onset of a nearly two-decade bear market in precious metals. We believe that the extreme pressure on gold shares over the past few weeks was related in part to liquidation of positions by Vanguard along with associated front running by short sellers. Let us hope that Vanguard’s record for timing and optics remains unblemished.
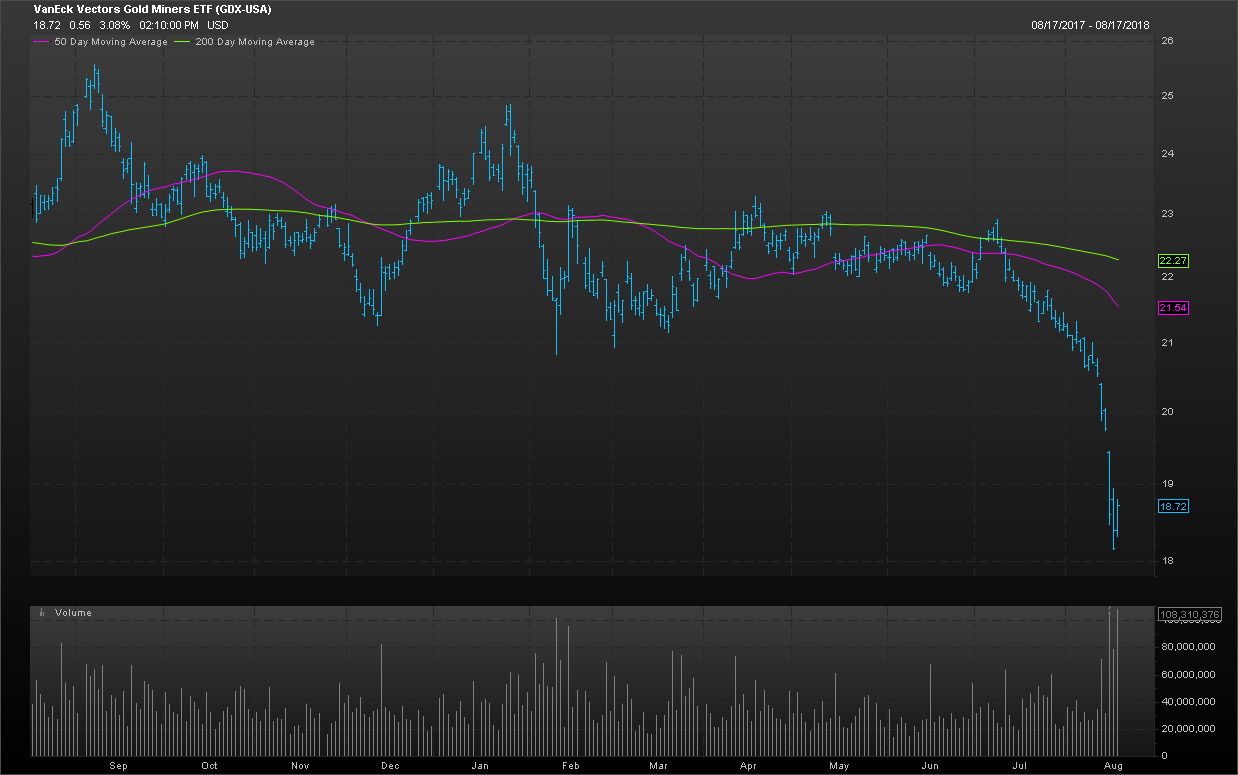
Extreme washout volume on spikes down for GDX:
From August 15 to 17, 2018, GDX (Van Eck gold mining ETF) fell from 1,975 to 1,857, or 6.5%, on successive volume days of 127, 78, and 109 million versus average daily volume of 34.7 million, or 3x the normal. Trading patterns have been similar for the more liquid mining equities that constitute the bulk of the underlying shares in the ETF. We believe (and expect that most market analysts would agree) that this sort of extreme trading pattern is characteristic of a spike bottom and exhaustion of bearish positioning.
Fundamental Outlook
The fundamental outlook for much higher gold prices continues to strengthen. So far, these positives have been ignored by mainstream investors. In our opinion, wider recognition will coincide with a resumption of the uptrend in the gold price, which we speculate to be imminent. In addition, we believe that a downturn in the US equity market will also signify at long last the following inescapable realities:
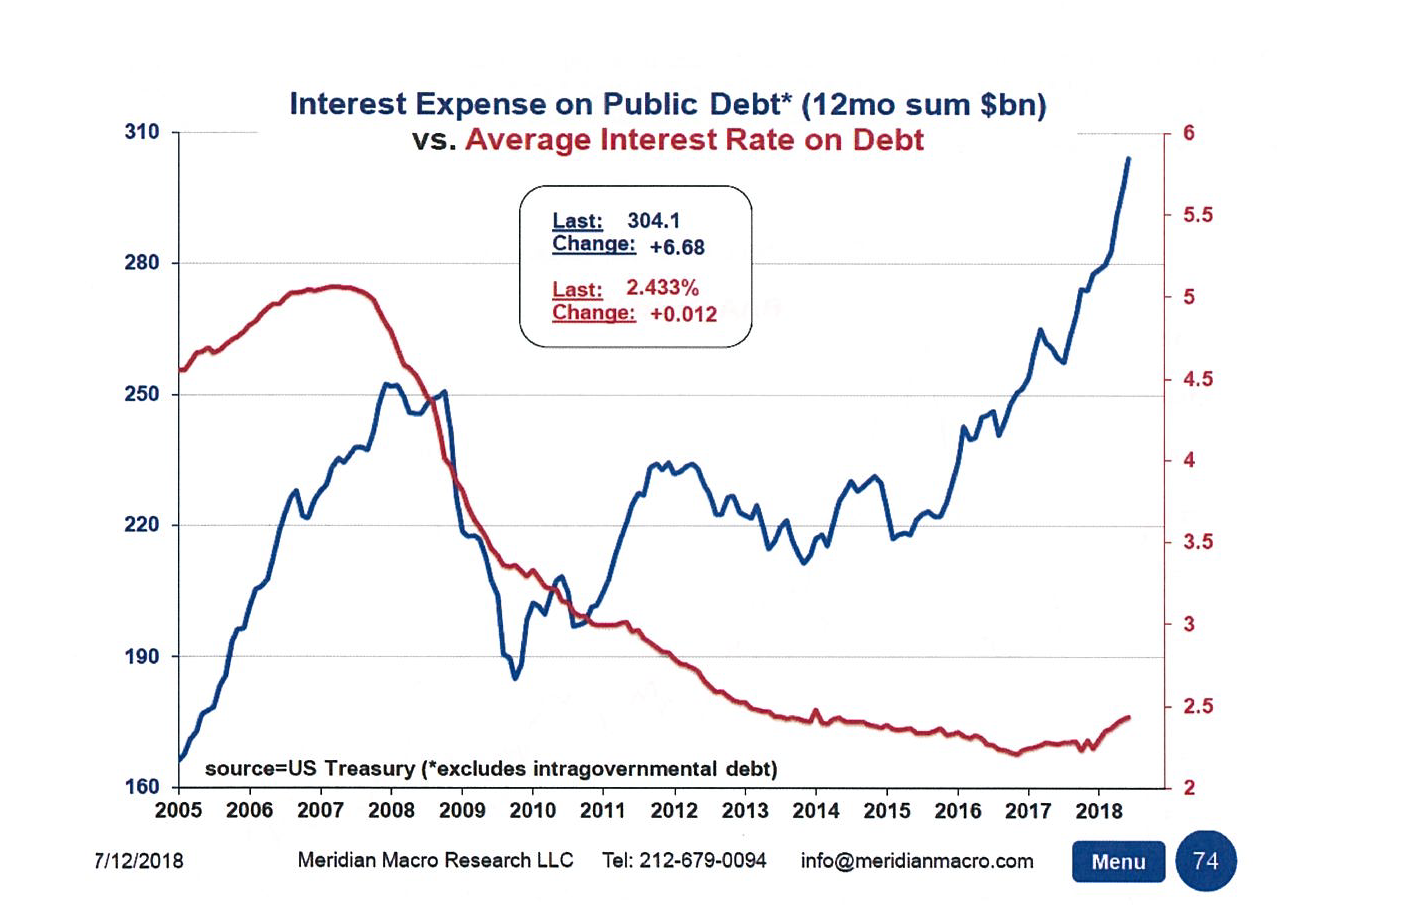
–The US fiscal situation is out of control. Trillion-dollar deficits will become commonplace, meaning annual increases in public debt of 5% or more. Economic growth seems unlikely to outpace this rate of increase without significant inflation, dollar weakness, and a rise in interest rates that will undermine financial-asset values. The trailing 12-month deficit through July was $784 billion, the largest since 2013. Corporate tax receipts are falling at a 20% year-over-year rate, while payroll tax receipts have just turned negative year over year. Most concerning is that interest expense, even in a low-interest-rate environment, are beginning to rise rapidly, now accounting for 7.6% of total outlays. Each 1% increase in average interest paid adds US$155B to the Federal deficit:
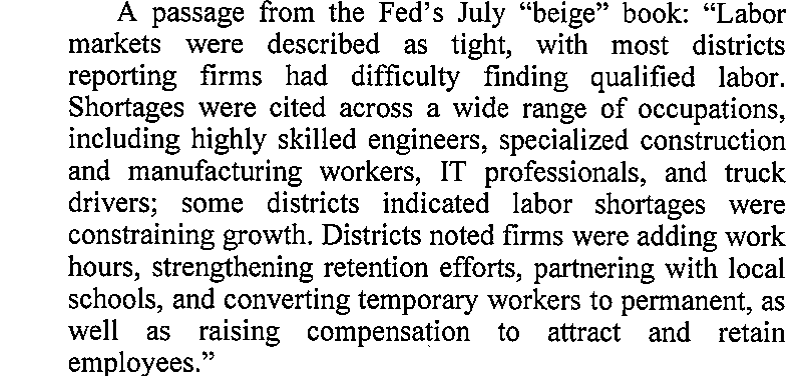
–Inflation is on the rise and, we believe, significantly understated by most conventional measures. The 2.9% June increase in the consumer price index was the highest in six years, and the third consecutive monthly increase. A year ago, the year-over-year increase was 1.7%. The labor market is tight, with frequent reports of shortages (thanks to Fred Hickey for catching the following passage in his August “High Tech Strategist” report):
As we have noted in previous commentary, the ECEC (Employer Cost of Employee Compensation) calculates the actual cost of employing workers in the private sector, something that the Labor Department employee cost index only estimates. Because it requires calculation of actual wages and fringe benefits across a large sample, the most recent ECEC data available is only through the first quarter of 2018. We believe that the Labor Department employee cost index, upon which the Fed and most economists rely, understates the real gain in wages. Still, this flawed index calculates the 12-month rise in labor costs at 2.8%, the fastest in a decade.
–Supply of newly mined gold has peaked out: According to Pierre Lassonde, billionaire founder of Franco Nevada:
If you look back to the 70s, 80s, and 90s, in every one of those decades, the industry found at least one 50+ million-ounce gold deposit, at least ten 30+ million-ounce deposits, and countless 5 to 10 million-ounce deposits.
But if you look at the last 15 years, we found no 50-million-ounce deposit, no 30-million-ounce deposit, and only very few 15-million-ounce deposits.
Lassonde, along with other leading mining executives, believes, as do we, that gold production is set to decline, perhaps for many years. In our opinion, a sustained gold price at least 25% higher than current levels would be required to justify the massive levels of investment that would allow the industry to sustain even current levels of production.
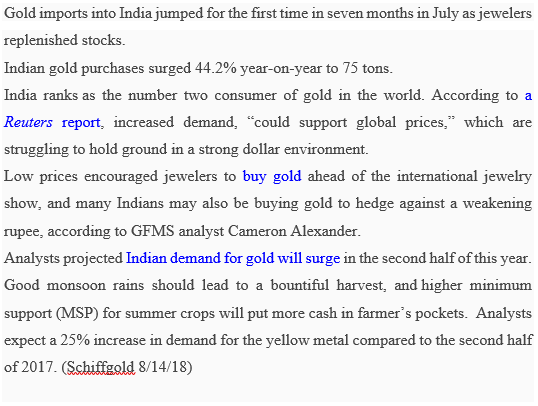
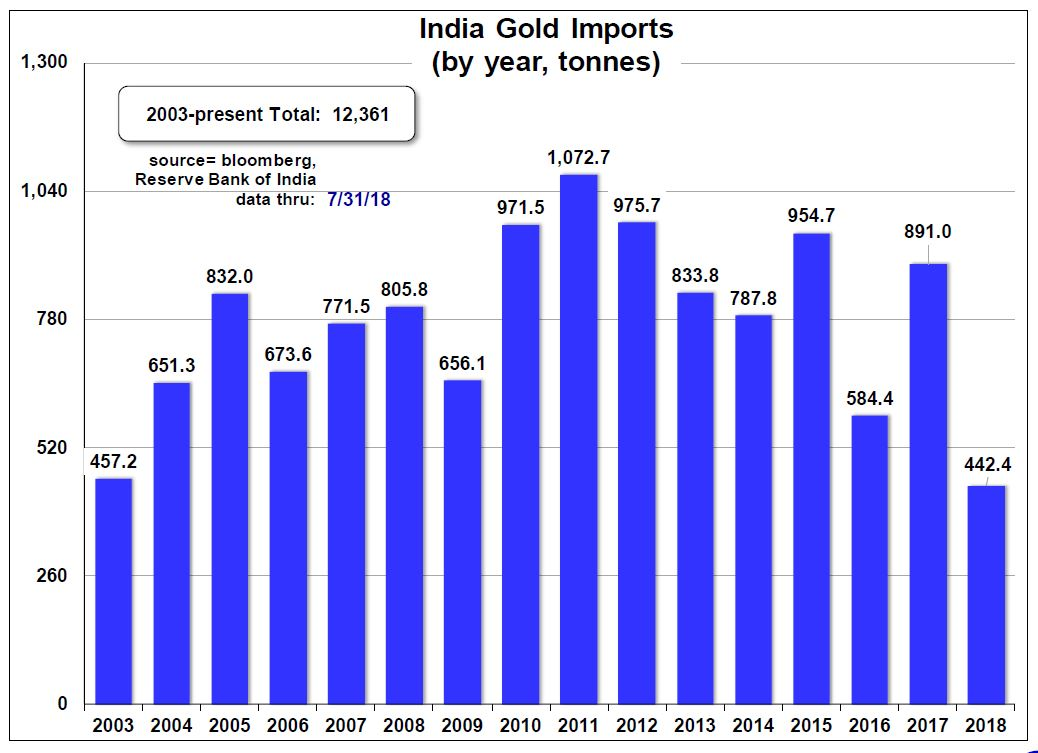
-Physical gold demand is entering a seasonally strong period. Moreover, demand from India, which along with China accounts for a major share of annual physical demand, is showing signs of revival (thanks to Howie Flinker for spotting):
Since 2011, Indian demand has declined by nearly 2/3rd. A stabilization or reversal of this trend would be a significant positive for the gold supply and demand picture.
What to do now?
To the gold shorts and dollar longs: Run for the hills! As painful as it has been for long-term investors in precious metals, hang in there! In our opinion, the extreme condition of market structure and investor sentiment suggests that, at the very least, a trading low is at hand, while broad macro- and gold-specific microeconomic fundamentals suggest a resumption of the uptrend in metal prices from the December 2015 low.
The current bout of extreme gold weakness coincides with resurgence in complacency despite the deepening crises in Turkey and Venezuela, continuing rise in populism across the Eurozone, acceleration of the deficit spending against the background of rising rates, increasing geopolitical risks, and historically generous financial asset valuations. In the past, any of these developments would have provided a catalyst for reduced risk appetite but no more – years of bailouts and market supports have in our opinion inured investors to the implications of systemic risks and reduced demand for systemic insurance solutions such as physical gold and mining assets. Throughout history, periods of complacency rarely ended well. The time to buy insurance is when risk perceptions are the lowest making insurance cheap relative to the risk. We believe that now is such a time.
John Hathaway
Senior Portfolio Manager
© Tocqueville Asset Management L.P.
August 21, 2018
This article reflects the views of the author as of the date or dates cited and may change at any time. The information should not be construed as investment advice. No representation is made concerning the accuracy of cited data, nor is there any guarantee that any projection, forecast or opinion will be realized. References to stocks, securities or investments should not be considered recommendations to buy or sell. Past performance is not a guide to future performance. Securities that are referenced may be held in portfolios managed by Tocqueville or by principals, employees and associates of Tocqueville, and such references should not be deemed as an understanding of any future position, buying or selling, that may be taken by Tocqueville. We will periodically reprint charts or quote extensively from articles published by other sources. When we do, we will provide appropriate source information. The quotes and material that we reproduce are selected because, in our view, they provide an interesting, provocative or enlightening perspective on current events. Their reproduction in no way implies that we endorse any part of the material or investment recommendations published on those sites.
View PDFYou are about to leave the site of Tocqueville Asset Management, L.P. The link you have accessed is provided for informational purposes only and should not be considered a solicitation to become a shareholder of or invest in the any mutual fund managed by Tocqueville Asset Management, L.P. Please consider the investment objectives, risks, and charges and expenses of any mutual fund carefully before investing. The prospectus contains this and other information about the Funds. You may obtain a free prospectus by downloading a copy from the Poplar Forest (www.poplarforestfunds.com), by contacting an authorized broker/dealer, or by calling 1-877-522-8860. Please read the prospectus carefully before you invest. By accepting you will be leaving the site of Tocqueville Asset Management, L.P
You are about to leave the site of Tocqueville Asset Management, L.P. The link you have accessed is provided for informational purposes only and should not be considered a solicitation to become a shareholder of or invest in the any mutual fund managed by Tocqueville Asset Management, L.P. Please consider the investment objectives, risks, and charges and expenses of any mutual fund carefully before investing. The prospectus contains this and other information about the Funds. You may obtain a free prospectus by downloading a copy from the Tocqueville Funds website (www.tocquevillefunds.com), by contacting an authorized broker/dealer, or by calling 1-800-697-3863. Please read the prospectus carefully before you invest. By accepting you will be leaving the site of Tocqueville Asset Management, L.P